I emphasize the word lead as lead forecasters are tasked with overseeing forecasts issued during their respective shift. The lead forecaster is a senior-level position, culminating in many years of experience in the National Weather Service or similar forecasting enterprise. For those unfamiliar, there are three forecasting level positions at the WFO level starting at Intern Meteorologist status, then promotion to General Forecaster (often referred to as Journey level), and finally Lead Forecaster.
A few disclaimers before we get started. First, I am in no way criticizing the local WFO in which this forecast originated from. In fact, I spent a fair amount of time volunteering in the DVN office during my undergraduate days at Northern Illinois University. In my (probably biased) opinion, they exemplify a great office with several forecasters, administrators, and staff that I still consider colleagues today. I learned forecasting and research tips at DVN that I still frequently use today.
Secondly, I do not wish to get into an argument about the content of the AFD in question or debate about the limits of modern day forecasting. I am simply using this space to dissect and provide (hopefully) constructive criticism to what I felt was a particularly poor discussion of the long-range prediction of weather across the (what I thought was supposed to be limited to!) DVN area.
In case you missed it, the AFD I am referring to is posted below.
This discussion was posted on 5 February 2014 at 2:33 PM CST:
ISSUED AT 233 PM CST WED FEB 5 2014Long term discussion:
MAJOR REGIME CHANGE STARTING DAYS 5 INTO DAY 10 NORMALLY SUGGEST
MAJOR CHANGES IN SOLUTIONS AND PREDICTABILITY NEXT SEVERAL DAYS.
THIS CHANGE WILL RESULT IN MUCH WETTER CONDITIONS ALONG WEST COAST
WITH MILDER TEMPERATURES AT/BEYOND DAY 10 FOR CENTRAL US. THE
MAGNITUDE OF ENERGY CHANGES IN THE PACIFIC ARE AMONG THE HIGHEST
I HAVE SEEN OVER A 5 DAY PERIOD USING MULTIPLE SOURCES IN 35 YEARS
OF ANALYSIS. THE MEANING...THIS WILL NOT BE A MINOR CHANGE AND
SHOULD RESULT IN MAJOR TEMP/MOISTURE CHANGES LASTING MANY WEEKS
AND QUITE POSSIBLY MONTHS. TELECONNECTION WEIGHTING SUPPORTS MAY
RESULT IN AN ACTIVE SPRING...MUCH MORE TYPICAL THAN WHAT HAPPENED
LAST YEAR WHICH THIS AUTHOR CORRECTLY ASSESSED WOULD HAPPEN LAST
WINTER. THERE MAY BE SIGNIFICANT CHANGES IN KEY INDICES USED IN
TELECONNECTION TECHNIQUES NEXT SEVERAL WEEKS DUE TO THIS REGIME
CHANGE. THIS WILL BE QUITE EDUCATIONAL TO MONITOR. THE REGIME WE
ARE ON A TRAJECTORY FOR...FAVORABLY SUPPORTS HIGHS IN THE 50S AND
POSSIBLY 60S AT TIMES BY LATE IN THE MONTH...QUITE A CHANGE FROM
PAST 2 MONTHS. THE WEST COAST AND INTER-MOUNTAIN REGION WILL SEE
IMPRESSIVE RAIN TOTALS FOR AT LEAST THE NEXT FEW WEEKS. THIS MAY
CONTINUE BASED ON ANALOGS AND STATISTICAL WEIGHTING IN
TELECONNECTIONS LOCALLY USED BY THIS AUTHOR...FOR MUCH OF THE
EARLY TO MID SPRING...POSITIVE IMPACTS TO WESTERN DROUGHT...HIGH
PW/S WOULD SUPPORT FLOODING RISKS THOUGH.

COMMENT...KEEP IN MIND REFERENCES MADE LAST FALL BY THIS AUTHOR IN
AFD/S THAT CORRECTLY DIAGNOSED OUR RISK AND THE REALITY OF PROLONGED
COLD OVER MUCH OF NORTH AMERICA.
This sparked discussion among students in the CoD meteorology lab, most notably several trying to find signs to point to the claims being made re: temp/moisture changes lasting "many weeks and quite possibly months." They asked me, "Is this for real?"
I had no answer for them.
Instead of telling them what I really felt, I played nice and began to investigate long-range signals using "local tools and techniques" that I have found to best diagnose dominant modes of atmospheric variability in the Northern Hemisphere. We first settled on the sentence with "energy changes." We were not quite sure what the forecaster was referring to. Energy is measured in Joules (J) and typically not displayed on a 2-D spatial plot. Perhaps the forecaster was referring to wind (a vector quantity driven by horizontal temperature gradients as defined by thermal wind) maximums at the tropopause level (jetstream) associated with Rossby waves traversing the Pacific? This section was unclear. Furthermore, how will these "energy" changes influence US weather for months to come? Will blocking in the Pacific force a western CONUS trough? We were mostly lost. During the latter half of the discussion, I felt like I was being sold snake oil. This section contained little/no scientific discussion, mixed with hand-waving black-box teleconnection weighting, and spiced with two tablespoons of chest bumping.
What teleconnections are being weighted? Why? What research papers suggest this is a valid methodology?
I happen to be quite interested in teleconnection relationships put forth by this author, but admittedly, am not sure which of the many are being discussed above. For sake of explanation of variability, let's quickly glance at the dominant mode of Northern Hemisphere variance (The Madden-Julian Oscillation [MJO]) and ENSO (the El-Nino Southern Oscillation; explains much less of the variability), both of which have been extensively studied via research.
MJO has exhibited no strong signal over the past month and continues so show no significant signs of tropical convective forcing (shown below). EDIT: As of the first draft of this BLOGpost, MJO is becoming slightly more active.
 |
| Phase diagram showing the evolution of the last 40 days of observations along with the 15 day ensemble GFS forecast. The yellow lines are the twenty ensemble members and the green line is the ensemble mean (thick-week 1, thin-week 2). The dark gray shading depicts 90% of the members fall in this area and the light gray shading indicates 50% of the members. |
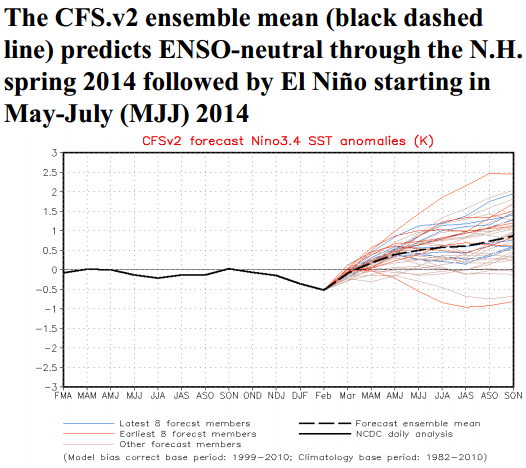
Thus, the forecast period in question actually corresponds to ENSO neutral conditions (via the ensemble mean) making it difficult to point to any clear signs of equatorial pacific oceanic/atmospheric forcing even when discussing a transition cycle.
This gets to a much larger issue with using individual teleconnections. Using regional spatial indices often result in poor prediction of weather conditions in other parts of the world. Uh, surprise! Earth's atmosphere is a chaotic system! There is no single teleconnection or magic bullet that will solve the issues associated with a Lorenz system. Instead, these teleconnections are playing in concert together, each bringing their own influence on temperature and precipitation patterns worldwide. This may have been the intent of the forecaster above, but the reader is left to guess.
Speaking from a persistence and snow cover perspective in conjunction with Atmospheric Angular Momentum (AAM), I would say there is a better chance for central US temperatures to be *below* average by the end of the month and continue into the first half of March, instead of the 50s/60s F suggested above! From my particular perspective, I care less about the fact that this is an AFD for the DVN CWA talking about western US weather and more about the fact this it is strictly baloney! This is much better fodder for a BLOG setting where one can more fully elaborate on the processes and teleconections in questions.
Here is the verification of 2-m temperature analysis since the issuance of the above AFD:
 |
| 2-m T anomaly for 2-5-14 to 2-23-14 via reanalysis |
Obviously, not a great forecast, but again, that is not necessarily the point of this post. Instead, if you are to go out on a limb with such a forecast, let's be transparent with some metric of verification. POD/CSI/FAR please! While an unverified forecast can still add value, I see no way a forecaster can improve his/her skill without some sort of verification metric.